I would like to thank Linas Linkevičius who shared his stories. It should be really interesting for anyone interested in history and politics. At least for me it certainly was. In this part, we talked about the origins of the Lithuanian Armed Forces, the challenges of reforming them at the beginning of independence, relations with neighbours, and the first steps towards the Alliance. They were certainly not easy.
In this part, the Ambassador and I talked about the first Chechen war, the issue of Lithuania's borders, the challenges of being Ambassador to NATO, the organisation's Secretaries General, and the events in Russia that could have changed the history of not only Russia, but also of Europe fundamentally.
In this episode, the Ambassador and I talked about the secret meeting of Rolandas Paksas and Artūras Paulauskas with the NATO Secretary General in 2000, the attempts to persuade the Seimas to allocate more money to defence, how the events of September 11th opened the doors of NATO, the memories of Belgian fighter planes taking off on the territory of Lithuania and much more.
In the last part of the mini-cycle, the Ambassador and I delved a little deeper into the period between 11 September 2001 and Lithuania's formal accession.
We talked about the opening of NATO's doors, about the first (and so far only) activation of Article 5. We asked the question, would it be possible to activate it now? Also Lithuania's challenges in the run-up to accession and adventures in the NATO corridors.
I was casually messing around and thought it would be fun to combine two of my favourite things: Sports and Data.
So, I tried to dig deeper into Men and Women 100M sprint olympic history, and with some help from SQL and Python I've came up with some relatively interesting conclusions.
1. USA is absolutely dominating this race. They've one over half medals in men's race. They have 56% of gold medals and 52% of silver medals. 'Only' 29% of bronze medals.
Women are less dominant and have 40% of gold, 27% of silver and 11% of bronze.
2. A lot of people think of Jamaica as a sprinters country. But if you look a bit deeper, it's kind of a myth. Sure, they have just 2,8mln., but still. You would expect them to be dominant, right? But they were not.
Through 2016 olympics (data are from 1896 until 2016), Jamaica won 21 total medals (13 by women and 8 by men).
Take Usain Bolt aside, and Jamaica have no olympic champion.
From 1976 when Donald Quarrie won silver in Monreal, Jamaica couldn't win a medal until 2008, when Usain Bolt snatched gold. If you take Usain Bolt aside (again). Yes, I know it's not fair, but stay with me. 🙂 Only Yohan Blake did win silver back in 2012. Other than that, there's nothing to show.
With women, it's a bit different story.
From 1984, they've won 13 medals, including 3 gold. Unlike men, they're leading the way in 100M sprint. In 2008 olympics, they took all three spots on the pedestal. In the next two summer olympics, they took two spots.
In conclusion, women are showing men the way in sprint. So, maybe Jamaica is dominant after all. Just in women's case. 🙂
3. First athlete to run faster than 10s and win a medal was Jim Hines in 1968. What's interesting, that until then, people were gruadally coming towards that goal, but after 1968 olympics, it took 16 years, until 1984 Los Angeles olympics, to break that 10s barrier. Carl Lewis done that. Why was that?
It's hard to say. Maybe that Jim Hines achievement was kind of a fluke. Because you would expect people to improve, so the simple guess would've been, that in 1972 it would happen again. But it didn't. Sure, you should take into consideration, that USA boycotted 1980 olympics in Moscow, so maybe it would've happened quicker. Who knows. In 1976 Haseley Crawford came really close and ran 10.06s. But fact to the matter is that it didn't happen and maybe that Jim Hines race was a fluke after all.
4. From 1992 no USA sprinter have won gold in the olympics. The clock is still ticking at least until Paris olympics in 2024. Knowing, that USA men sprinters have 56% of gold medals, it's kinda unreal.
On the other hand, from 1932 until 1960, USA men sprinters have won gold. So, for 28 years, USA had the best sprinters in the world. If you want to go further, from 1932 until 1972, they've lost only once. In 1960 olympics, Armin Hary did won gold.
Sorry, if I've done some spelling mistakes. It's almost 2am, when I'm writing this. 😁 Hopefully it was at least somewhat interesting.
Silver Medals
Bronze Medals
Gold Medal Winning Times
Gold Medal Winners (by Country)
100M Winners (Results, Nationality and Year)
Medals Won by Jamaica (Men and Women)
100M Winners by Year
100M Winners by Year (Women)
Euroleague
I promise, this is going to be the only basketball analysis, that I'll do. Well, maybe one of the two. Recently, I've found Euroleague basketball data, that covers more than 20 years. From 2000 until 2021. Last two seasons are excluded, so some things might've changed, but it hadn't changed the bigger picture. This is from so called "modern" Euroleague, which is nonsense, but it's a topic for another day.
I've took 20 games as a benchmark for a player, since I think, that is a fair number. It means, that you've played at least a full season or close to it and your numbers wasn't a fluke.
Just for fun, I've created some player clubs, that I'll explain them later. Without further do, let's get into the action. 🙂
1. From the TOP10 Euroleague's 3 pointers made list, only one shot at least 40%. He was Sergio Rodriguez, but since then, his percentage dropped below that mark. From that list, Vassilis Spanoulis jumps out at only 32%. But he was excellent in the late game situations, so don't let that number fool you.
2. In the NBA, as a truly great shooter, player needs to reach 50-40-90 marks. At least once in his carrer. In the Euroleague, only 4 players in history had reach that mark. Out of that list, a guy, who jumps out, is Fran Pilepic. I've never heard of him, but he is a Croatian sharp shooter, who played 2 seasons in the Euroleague and averaged 8.1ppg. Other three players are well-known: Luigi Datome, Janis Strelnieks and Nando De Colo.
3. European basketball is valued for it's team play, so maybe there's no surprise, that just 4 players averaged more than 20ppg in their careers.
Top of that list is Euroleague legend Alphonso Ford. But the other 3, might surprise you. My bad, I've abandoned my rule here. Derrick Hamilton, who played back in 2000-01 season, averaged 21.8ppg, but played in just 10 games. Jemeil Rich, who also had a short stint in Lithuania, playing for "Sakalai" Vilnius, averaged 21.5ppg in the 00-01 season playing for the Lugano "Snakes". The last one is Marc Salyers, who averaged 21.8ppg in the 07-08 Euroleague campaign.
So, as you can see, only Alphonso Ford played in more than 20 games, from this list (54). This list only shows, how hard is to score in the Euroleague.
4. Defense is being valued in Europe. I've looked at players, who averaged at least 1 steal and 1 block per game in their careers. The list was shorter, than I've expected. It included just 4 players. Rashard Griffith, a "Kinder" Bologna legend, Andrei Kirilenko, Marcus Goree and Brian Randle, who played for "ALBA" Berlin and "Maccabi" Tel Aviv.
5. A list of players, who averaged more than 2 steals per game, reached 6. It includes some legendary names, that needs no introduction: Dejan Tomasevic, Jeff Trepagnier, Manu Ginobili, Fred House, who left a significant mark in Lithuania, Riccardo Pittis and David Vanterpool.
Since I've reached maximum amount of symbols, the rest I'll take to part 2. 🙂
Euroleague Players Club (Percentage splits 50/40/90) (pic. 1)
3PT Shooting % and Attempts (pic. 2)
Points Per Game (pic. 3)
Blocks and Steals Per Game (pic. 4)
Euroleague(Part 2)
1. Only three players in modern Euroleague history averaged more than 3 blocks per game. One of whom is Grygorii Khizhniak, who played for "Zalgiris" Kaunas in the early 00's. He still holds the record for blocks average, averaging 3.19 per game. Nobody came close since then, even though more than 20 years has passed.
2. In my opinion, a solid point guard should be able to run the team as well as be able to score himself. So, I've created a club, where player averaged at least 10ppg and 4.5apg. The list is quite short. It includes only 8 players. All of them are Euroleague legends, maybe except Thomas Heurtel. There was one form "Zalgiris" Kaunas player Ed Cota, who left his mark in Kaunas, in the first part of the 00's.
3. I've looked at players effeciency and created a club "at least 15ppg-35%3PT-50%2PT-85%FT". To me, it shows, that player is an elite scorer. 5 players made that list. All of them are well-known for their scoring ability.
4. Yet another club "at least 15ppg-4.5FTA". It showed players, who were not just great shooters, but could also drive the ball and get to the line. To me, one guy who jumped out of that list is Panagiotis Liadelis. He played in the late 90's and early 00's for the various teams. It's surprising that he made the list, what stoods out, is that he averaged 7.71FTA per game. He lived at the line. Closest to him is Dejan Tomasevic with 6. Even though Liadelis was hard to stop, he's barely being mentioned.
5. It's the last club, that I've created. What I've found, is that only two players in history have averaged double-double. Is Joseph Blair and Mirsad Turkcan. A couple of players came close to that mark.
The bottom line, that I've come to, is that is really hard to collect numbers in Euroleague, and you have to be a really good player, to stood out.
Also, it was fun, to look back at Euroleague legends, who are being forgotten for whatever reason. And I think, that list's like these, can keep there legacy going.
Blocks Per Game
Assists and Points Per Game
PPG and Shooting %
PPG and Free Throw Attempts
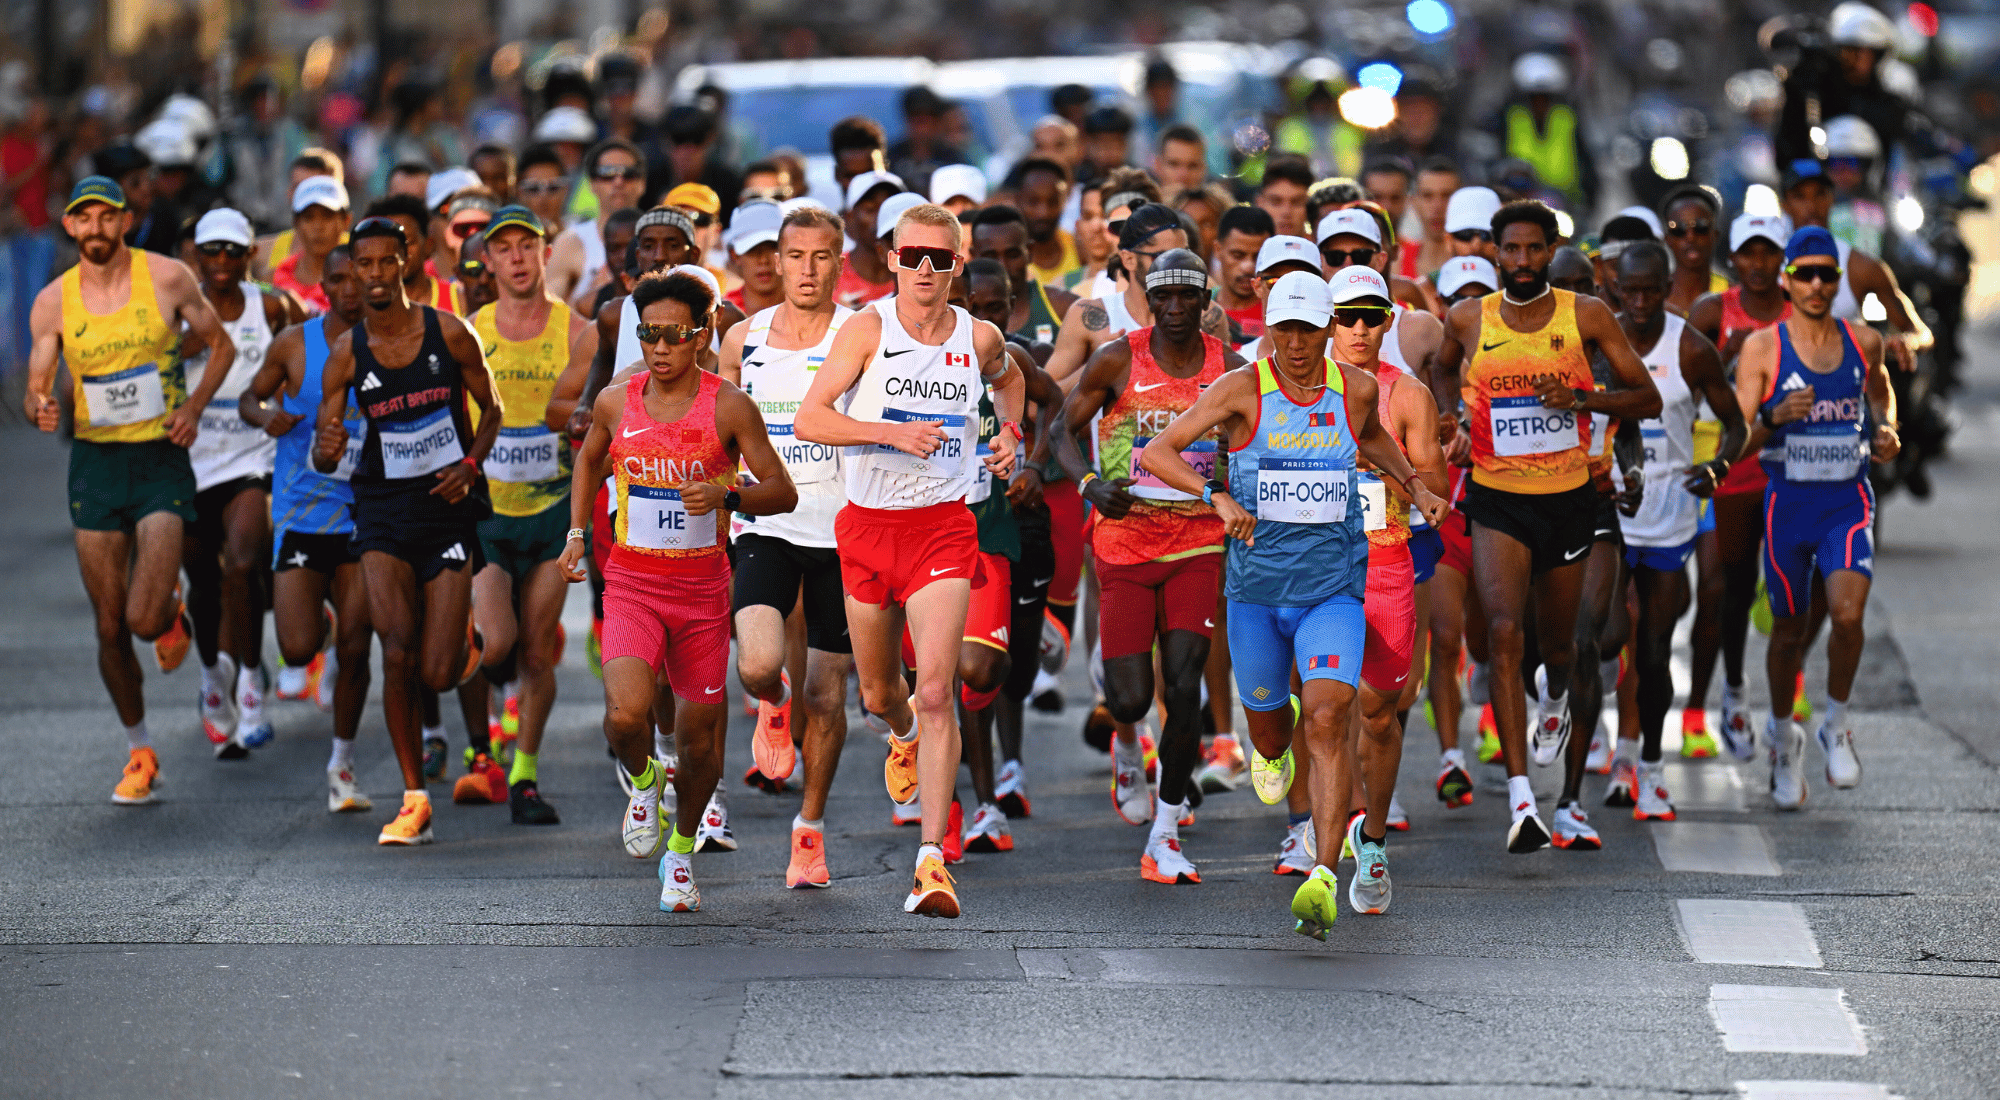
Olympic Marathon Medal Winners Analysis(Men)
This time I've done some analysis about Olympic Marathon Medal Winners.
There is a common opinion, that African runners are dominating this event, but reality is a bit different.
Sure, a lot of African countries were still colonies pre-WWII period. For example, Kenya got their independence in December of 1964, so it's hard to judge those numbers objectively. But even after the majority of African countries got their independence, they still weren't dominating this competion as might think. It's only men race, but some things jump out.
1. African runners are taking charge, by winning last four marathons ( this data don't include 2020 Tokyo games, but it's winner was from Kenya. Just to mention.)
2. Until 1960, only one runner from Africa (RSA), won olympic gold in men marathon.
3. It seems, that African domination begins about now, because from 1968, when Mamo Wolde won gold for Ethiopia, until 1996 when RSA won gold in Atlanta, no African runner have snatched first place in Olympic men marathon.
4. When you look at the medal table, in the Top10, just 3 countries are from Africa. Ethipiopia stands 1st, Kenya was 4th, but after Tokyo 2020 games they went to 3rd and RSA is 5th. Surprisingly, France is still 4th, but their last medal was back in 1956. What's ironic, that French athlete named Emile Champion didn't win. He finished second back in 1900. :) He lost to his native Michel Theato.
5. Europeans are doing pretty well in this discipline. They are not overmatch as much, as I've thought at first. Even in the last olympics, they've won silver and bronze (silver went to Netherlands and bronze to Belgium). In the medal table in the Top10, there are 4 European countries.
I'll do women race a bit later, so maybe the view will be a bit different.
Bottom line is that, even though African runners won last 4 Olympic men marathons, but their domination is not as obvious, as you might assume.
P.S. I've done this using SQL and Python. The variety of charts are not plenty, but I've tried to make it understandable and clean.
Marathon Winning Times (Men)
Medal Count (by Country)
Marathon Times (French Athletes)
Marathon Results (USA)
Olympic Medals (Marathon (Women))
As promised, I've done some research about olympic women marathon. As I was preparing, I've looked at the data and saw, that first olympic marathon was ran back in 1984. I thought it was some kind of mistake, but no. First men marathon was ran in 1896. It took 88 years for women to compete in olympic marathon. Alexandria Gouveia wrote in her article: "Who run the world? Girls! Well, actually, not before the 1970s, thanks to stubborn US governing bodies.
The Amateur Athletic Union, an organisation founded to “promote physical fitness”, banned women from competing in marathons after incorrectly claiming that long-distance running could cause infertility."
Undeterred, in 1966, after having her race entry denied with a note claiming women were not physically capable of running a marathon, Roberta Gibb ran the Boston Marathon. She hid behind a bush at the start of the race before taking part as an unregistered runner.
A year later, Kathrine Switzer was granted entry to the Boston Marathon after registering as a gender neutral-sounding KV Switzer. However, three kilometres into the race, an official infamously grabbed her in an attempt to physically throw her out. She managed to finish the race, and went on to run again in 1968 and 1969. However, it wasn’t until 1972 that women were officially allowed to participate in the Boston Marathon. Switzer returned in 1975 to get a personal best of 2 hours 51 minutes.
By the mid-1970s, running began to be recognised as a popular sport among women, but it was still not enough to convince the Olympics to hold a women’s marathon competition. Enter Switzer again. After much campaigning and a hard-working partnership with Avon, she is now considered instrumental in getting the women's marathon recognised as an official discipline at the 1984 Olympics.
Because of that, data sample size is really small and that's why it's hard to make any conclusions out of it.
Japan is second in the medal table, but their last olympic medal was back in 2004. Kenya is running away with it, having 5 in this table and adding two more in the last olympics ( this data doesn't include Tokyo 2020 games).
There were 10 athletes who ran marathon faster than 2:25:00, which is really impressive. For example, in the past Tokyo olympics, none of the athletes reached that mark. Peres Jepchirchir won with 2:27:20. But it was after Covid-19 pandemic, so no surprise, that results weren't great.
If we will look at recent results, it seems, that Ethiopia and Kenya are heading for a heated rivalry. Women record belongs to Mary Jepkosgei KEITANY. Meanwhile olympic record and WC record is being held by Tiki GELANA and Tigst ASSEFA, who reached the record in September of 2023. She ran a marathon in 2:11:53, which is still under ratification, but if it's approved, then it will be more than 2 minutes faster, comparing to the previous one. It gives a hope, that olympic record may fall in the next olympics. This is it for now. Until next time.
Marathon Winning Times (Women)
Medals Count (by Country)
Countries of Athletes who ran <2:25:00
Countries of Athletes who ran <2:25:00 (Table)
Military Spending
By using SQL, Python and a little bit of Excel, I've done a small analysis. This time is not about sports. It's about countries defensive capabilities. I found out some interesting things. We are kind of in trouble, but on the other hand, things might be not as bleak as public opinion may suggest.
1. USA is still head and shoulders above everybody else, when it comes to military spending. In 2023 USA will spend 750bln.$. China is in second place with 237bln.$. Then it's Saudi Arabia, India, UK and so on. Germany is sixth on this list. Problem is, that USA needs to worry about every region. Weather is war in Ukraine, conflict in Israel, tensions in the Pacific. Basically, every bigger conflict involves USA one way or another. That's why, that gap between China and USA might not be as big as it may seem. Militarily, China worries basically just about Pacific region.
2. Henry Kissinger, when he was a secretary of state, used to ask a question: 'Who do I call when I want to talk to Europe?' As Matthew Karnitsching put it in his article: "No one’s calling anyway. Of the myriad geostrategic illusions that have been destroyed in recent days, the most sobering realization for anyone residing on the Continent should be this: No one cares what Europe thinks." And that's true. Even though, EU has the third biggest GDP in the world, trailing just USA and China. But unlike those two countries, EU can't defend itself. And it's by choice. In the 1990, out of the top 5 EU economies, only Italy spent less than 2% GDP on their defense. France was around 2.8%, Germany 2.5%. Right now, only France hovers around 2%. Germany's about 1.4%. Have in mind, that there's a war going on in Europe. Problem is, that there are no urgency. Even after the eruption of war, there were no significant changes. And there are other problems too: migrant crisis in the south, tensions between Kosovo and Serbia or Greece and Turkey. It seems, that very little is being done about solving those issues. So, maybe we shouldn't be surprised about EU irrelevancy after all.
3. Another thing, military size. Sure, weapons matter, and western world have a variety of them, but as we're seing, humans still matters very much. Somebody needs to control drones, tanks, war planes and etc. And there, we have an issue. If you look at the top 10 military sizes, there're no European countries. And potentially, it could be an issue. Authoritarian countries doesn't care about human lives. So, we don't spend enough on military, doesn't have military size, so what do EU have?
I've also added a table about nuclear weapons, since they are always an option.
Bottom line is this, if EU won't change it's approach, we might be in a world of trouble, since USA can't keep their eye on everything.
P.S. Here's a link to Karnitsching's article. I think it's worth reading, since he explains pretty clearly the situation, that Europe is in right now.
https://lnkd.in/eWTdueSs
Top10 Countries by Military Spending
EU GDP per Country
Top5 Biggest EU Countries (Military Spending)
Army Active Duty and Reserve
Total Military Size
Top5 Militaries (by Size)
Nuclear Weapons (Table)
Lack of Education
There's an old saying: "Knowledge is king". It's true in a lot of cases. Because of the lack of education we tend to elect bad politicians. That's why wars happen, global warming occurs and a lot of other issues take place because of the lack of education. That's why I've looked at education stats worldwide using SQL and Python.
There was a clear domination by African countries, but some numbers were staggering. For example, less than 40% of South Sudans boys finish primary school. With girls, situation is even more tragic, with about 20% percent of girls finishing primary school. Overall, we have 8 countries in Africa, where less than or around 40% of kids finish primary school. Central Africa Republic hovers around 52%. With girls, situation is much more worse in that area.
If you look at other stats, situation is a bit better with girls, if you look at literacy rate age 15-24. There girls show better results than boys. But numbers doesn't get much higher than 70% of girls that can read. Results are worst in CAR, where only 30% of boys can read age 15-24. Niger is not that much better.
In South Sudan, Equatorial Guinea or Eritrea, more than 60% of girls drop out of primary school. With male, numbers are a bit lower, but it still exceds 50% in those mentioned countries (except Eritrea). Even in the country like Senegal, that you would consider pretty stable, that number exceeds 30% among boys. Sure, Casamance conflict is still happening, but it's low-level.
I've looked at birth rate and unemployment rate, but they don't coinside necceserily. For example, Niger is leading the way with 4.6 child on average, but unemployment rate is only 0.47%. Chad is second with 4.2 child per family and 1.89% of unemployment rate. To be honest, I don't know how valid those work force numbers are.
The thing is, that those countries, majority of them, do have natural resources. Whether is oil, uranium or gold. Imagine, if education level would be higher, how so much better continent would be doing. And it would solve a lot of problems. It would reduce migration rate to Europe, there would be less wars and countries would decrease their dependency on foreign aid. Can it be achieved, it remains to be seen. For now, until next time. :)
Birth Rate and Unemployment (by Country)
Primary School Completion Rate
Youth Literacy Age 15-24
Out of Primary School Rate
China's Global Role
I've wanted to dig deeper into China's global role. By using Python I've looked at some basic data and came up with a few conclusions.
1. Like Jay-Z said, I'm not a businesman, I'm a business, man. If you look at the top Chinese importers, you'll see- USA, South Korea, Japan, Australia. Germany is 7th on that list. On the other hand, NATO describes China as the biggest long-term threat. But they do huge amount of business. How do those points match up?
2. Potentially, it may have serious repercussions. It looks like China might be preparing for war, if you look at the amount of stocks of rice and wheat. Sure, it might mean nothing. Recently, there were huge floods in China, so you can use that stock there. Maybe it was preparation for those accidents. But... Since biggest economies are so dependable and have such a big ties, China might not even have to go to some sort of military escalation.
In the US, 80% of shore cranes have been made by ZPMC, that's Chinese state-owned company. Recently, there was a podcast by WSJ, where they were talking about potential spying. There was a case, where US officers found 12 modems on those cranes, even though, they weren't suppose to be there. But if they don't want that, they can mess with supply chains.
When China was in lockdown because of Covid pandemic, world supply chains got really messed up. Prices sky rocket. So, if China would want to be mean, unlike Russia, they don't necessarily have to go to armed conflict. They can mess up with a lot of different things.
And yes, China have their own problems. Fertility rate, youth unemployement, stagnation in the construction sector.
USA is trying to limit their growth, but to a limited success thus far. Maybe in the near future they'll get more strict on sanctions.
On the other hand, China exports more to those countries, that they import. So they do need those markets like USA, South Korea or Japan. They export to USA 501bln.$ worth of goods, but import only 165bln.$ worth of products. With other countries is about even, but still. In a way, situation is similar to that Simpsons episode, where doctor told Mr. Burns, that you have all possible diseases, but they're all in a perfect balance, so you are totally fine, but a small draught can kill you. And Mr.Burns replied, I'm indestructable.
Maybe that balance keeps armed conflict away. Like, those countries understand, that they need China and vice versa. Even though, they don't want to admit that.
But in the end, I think, that China do have a small upper hand. Here's why:
Last year, out of ten most sold electric vehicle models, seven were Chinese made. Other two was made by Tesla and one by VW.
And second, last year they made 250 GW by using solar plants. USA came up second with 90 GW.
Knowing, that there's a green push going on, and it will be stronger, China have control of a market, of two important sectors. Can the rest of the world catch up? It remains to be seen.
I'll attach diagrams below.
China Export (2023)
China Exports by Country
China Imports (2023)
China Imports by Country (2023)
Solar Energy Production by Country
China's Emigration
Recently I've been listening to The Economist podcast about Chinese fleeing the country. I thought it would be fun idea to look at the bigger picture. By using Python, I've tried to look at some things.
1. Emigration. From 2009 until 2013, China posted more than -6% of emigration. It means, that more people were coming than leaving. During first two Xi's years in office, emigration recorded -7.58% in 2012 and -8.20% in 2013. But next year it flipped to +1.79%. What happened? Xi Jinping took control of major power centers in China, the party, the army and the state. Plus, rejected any turn to any Western-style liberization. And people reacted.
This year emigration expected to become negative again, but...
NPR.org published an article, where they said, that 13.500 millionaires were expected to leave China in 2023. A year earlier, 10.800 left China.
Now, it may look like low number, since there are 4.15 million millionaires, that live in China, but trend doesn't look good, because middle class follows.
Last year, Japan gave 2k business manager visas to Chinese sitizens, which was a record.
nikkei.com in october wrote: "According to China's State Administration of Foreign Exchange, which tracks monthly international financial transactions by domestic banks on behalf of businesses and households, the net outflow reached $53.9 billion in September." It was highest number since 2016.
Extremely strict Covid lockdown measures had a huge impact on that emigration wave.
2. Fertility
It's a well-known issue, so I won't spend much time there. You can see all in the chart. Even though China lifted one child restriction in 2015, it didn't produce the results, that Chinese government had expected. It was declining after that pretty much every year.
3. Ageing
It's nothing new. Europe age's too. Badly.
Statista recently published a nice bar, where it shows ageing situation. I'll publish it below.
In 2013, there were 73.9% of people age 15-64. Last year that number shrunk to 68.3%. It's 5.6% difference in a decade.
Let's try to connect points there. Their upper and middle class are leaving. As of right now, not in a huge capacity, but that number is increasing. It means, that it'll be harder to reboot economy. You have an ageing population, that will be needed to take care of. On top of that, you have struggling economy that USA just put sanctions on.
Now, China won't collapse. But in countries like China or Russia, there's an unwritten rule- we take care of economy, you don't go to politics. But what if economy struggles?
Age Distribution in China (2013-2023)
Emigration in China
Birth Rate
Millionaires in China (Table)
German Politics
German ruling parties had a subpar performance in this years EP elections. Main ruling party SDP managed to receive only 13.94% of votes. Next major election will be held in the fall of 2025. But people are showing signals, that they're unhappy. I've looked at some categories and tried to make some sort of sense of it.
1. German economy is struggling. And it's been that way for a while. Corporate Finance Institute is saying, that for a developed country 2-3% of GDP growth is being considered normal. In the last seven years, German economy reached that mark only once in 2021 (3.16%). But in 2023, they've possesed -0.30%. The German economy is seen growing by only 0.1% in 2024, well below the euro zone average of 0.8%.
2. Inflation. If a country can keep inflation around 1-2%, then it's being considered acceptable, but in the last three years, since 2021 inflation sky-rocketed by reaching it's peak in 2022 with 6.87%. But it was a universal problem. This year it's expected to ease to 2.4%, but the thing is, that in politics, people tend to remember bad things far longer, than the good ones. And inflation is still significantly higher, than their recent GDP growth.
3. Illegal immigration. It has been a problem since 2016, when 112k illegal immigrants entered Germany. But there's very little, that has been done about it. Or those measures aren't working. Last year, from January until September more than 92k illegal migrants have crossed German border.
There was 91986 illegal immigrants in 2022. It's a huge issue, that far-right parties are running on.
Other than that, they're doing pretty well. Unemployment rate is relatively low just around 5.9%, their military spending has finally reached NATO target of 2%. But it looks that their problems are bigger than their achievements and EP election results showed that. Good thing is, that they have more than a year to fix those issues. Because if they won't, then next years Bundestag election results could present some unpleasant surprises. We'll see. There are some charts below that I've created by using Python program.
Germnay's GDP Growth
Inflation
Illeagal Migration
Illeagal Migration (Until 2023-10)
USA Elections
As US presidential elections looms closer by each and every day, I thought it would be a good time look at the past election results and see what had happened before. By using Python, I've done some charts and some counting. I've used data from 1976-2020. So, let's take a closer look.
1. As you may very-well know, this November there won't be just presidential election. People of US will also elect all 435 members of the House of Representatives and 34 of the 100 Senate members. In this analysis, I've looked just at presidential and senate election results.
2. You can see in the Senate election chart, that it looks somewhat like seismograph diagram. By almost every election, results do change drastically. If before 2000 you can see at least a little stability, after the start of the new millenium it goes up and down by every election. Since senate, at least part of it, is being elected every two years, usually it goes badly for the elected president. Even for Barack Obama, who was very popular in 2008, in 2010 Senate elections, democrats got defeated significantly.
3. In total, Democrats have a little advantage against Republicans with 391 versus 375. Other 9 was won by other parties.
4. If you look at the swing states, results are pretty similar.
5. Presidential chart looks pretty interesting. Especially the 1984 election, where Ronald Reagan won 48 of the possible 50 states. Only states, where Democrat Walter Mondale won, was Minnesota, which was his home state and where he won by 0.18% and Disctrict of Columbia. It was the last time when candidates were separated by double digits in the popular vote.
6. Presidential chart doesn't tell the whole story. It's not necceseraly how many states you win, but which states. Because of it's electoral system, the size of the state matters way more.
7. Overall, Republicans are leading the way 358-254 state wins in the presidential elections.
8. Since 1976, there were few Democrats, who won senate elections 6 times. Republicans had two members of senate, who won it's elections 7 times.
When people say, that Biden was too old to run for his second term, Republican Orrin G. Hatch finished his last term when he was 85. He spent 42 years in the Senate.
9. Ronald Reagan dominates with 92 state wins. He won 44 states the first time in 1980 and 48 in 1984. Amazing.
Bill Clinton won 65 in his two races. He's leading the way for the Democrats. Barack Obama is second with 56.
10. Swing states do matter a lot. If candidate wins majority of swing states, he becomes a president. That was the case in every election since 1976. And probably that trend will continue.
Senate Wins by Party
Senate Wins by Party
Senate Wins by Party in Swing States
State Wins by President
Total State Wins in Presidential Elections
Most Senate State Wins by Candidate
Most State Wins by Presidential Candidate
Vince Carter Shooting Chart
By using Python, I've tried to create a basketball shooting chart. Since it was my first one, it do have a lot of flaws. Hopefully, in the future it will be better. Here I've randomly chosen dataset from 2001 NBA playoffs first round. And also, you can see Vince Carter chart in their first round series against the New York "Knicks".
By using data from 2021 NHL season, I've tried to look from where most goals were scored. Data is a bit outdated, but I think that you can still get a pretty clear picture. Distance was measured by feet.
Goal Density Map
NHL
I wanted to try something new, so I tried to use R instead of Python. It was a while after my last try with R, so here are some basic calculations and charts. It was a bit easier, than using Python. Like 10% more simple.
Here I counted some NHL stats from last season. Main focus was on goals scored and goals allowed.
I compared expected goals and actual goals scored. After that I counted the difference and looked which team outscored it's expectations.
For ex, "Sabres" and "Blue Jackets" scored more goals, than xG showed.
"Flyers" allowed more goals, than they were expected. Going back to the charts, It's not that impressive, but it took some time to remember things.
By using R, I tried to look at 1995 NBA Draft Class and compare it to other classes. It's one of my favourite and a bit forgotten class, since it has some really good players. I tried not to put to much info into the post, so I will split it into few parts.
First of all, I've looked at some basic metrics. Points average, minutes avg, field goal percentage, average games played and free throws attempted per game.
Also, I've counted top5 best and worst draft classes by those metrics. Why some of those classes are better than the other, I'll try to explain in my next post.
P.S. Since 2025 season data was taken before the end of the season, It stands as NA, because dataset is incomplete.
Comparision (1995 Draft Class vs The Rest)
1995 Draft Class Averages
Stats Comparison (1995 Class vs Others)
Top&Bottom Draft Classes
Points Per Game Average (1995 Draft Class)
Is the Bulls’ close connection to the city of Chicago fading?
How important is the connection between the team and the city it’s located? Well, I don‘t think, that city can truly get behind the team if that team doesn‘t feature values, that particular city represents. Perhaps no team has been more synonymous with the place it calls home more so than the Chicago Bulls.
Historically, since its incorporation as a city in 1837, Chicago was an industrial place. They were manufacturing a lot of stuff, from bicycles and radios to steel. During WWII steel mills of Chicago accounted for 20% of total steel production in the USA. Another thing is that a lot of people have migrated to Chicago during World Wars. Especially from Europe. They started from nothing and had to build themselves. In a way, Chicago still has that blue-collar mentality.
After previous stints by the Chicago Stags and later the Chicago Packers/Zephyrs, the Chicago Bulls arrived as the third and final franchise that would call the Windy City home. In my opinion, they couldn’t have done a better job choosing a mascot and logo when it comes to representing that grit and toughness that has defined the city. From Jerry Sloan and Chet Walker to Michael Jordan and Scottie Pippen, this is a team of fighters and intense personalities.
But lately, I think they’ve begun to lose that quality.
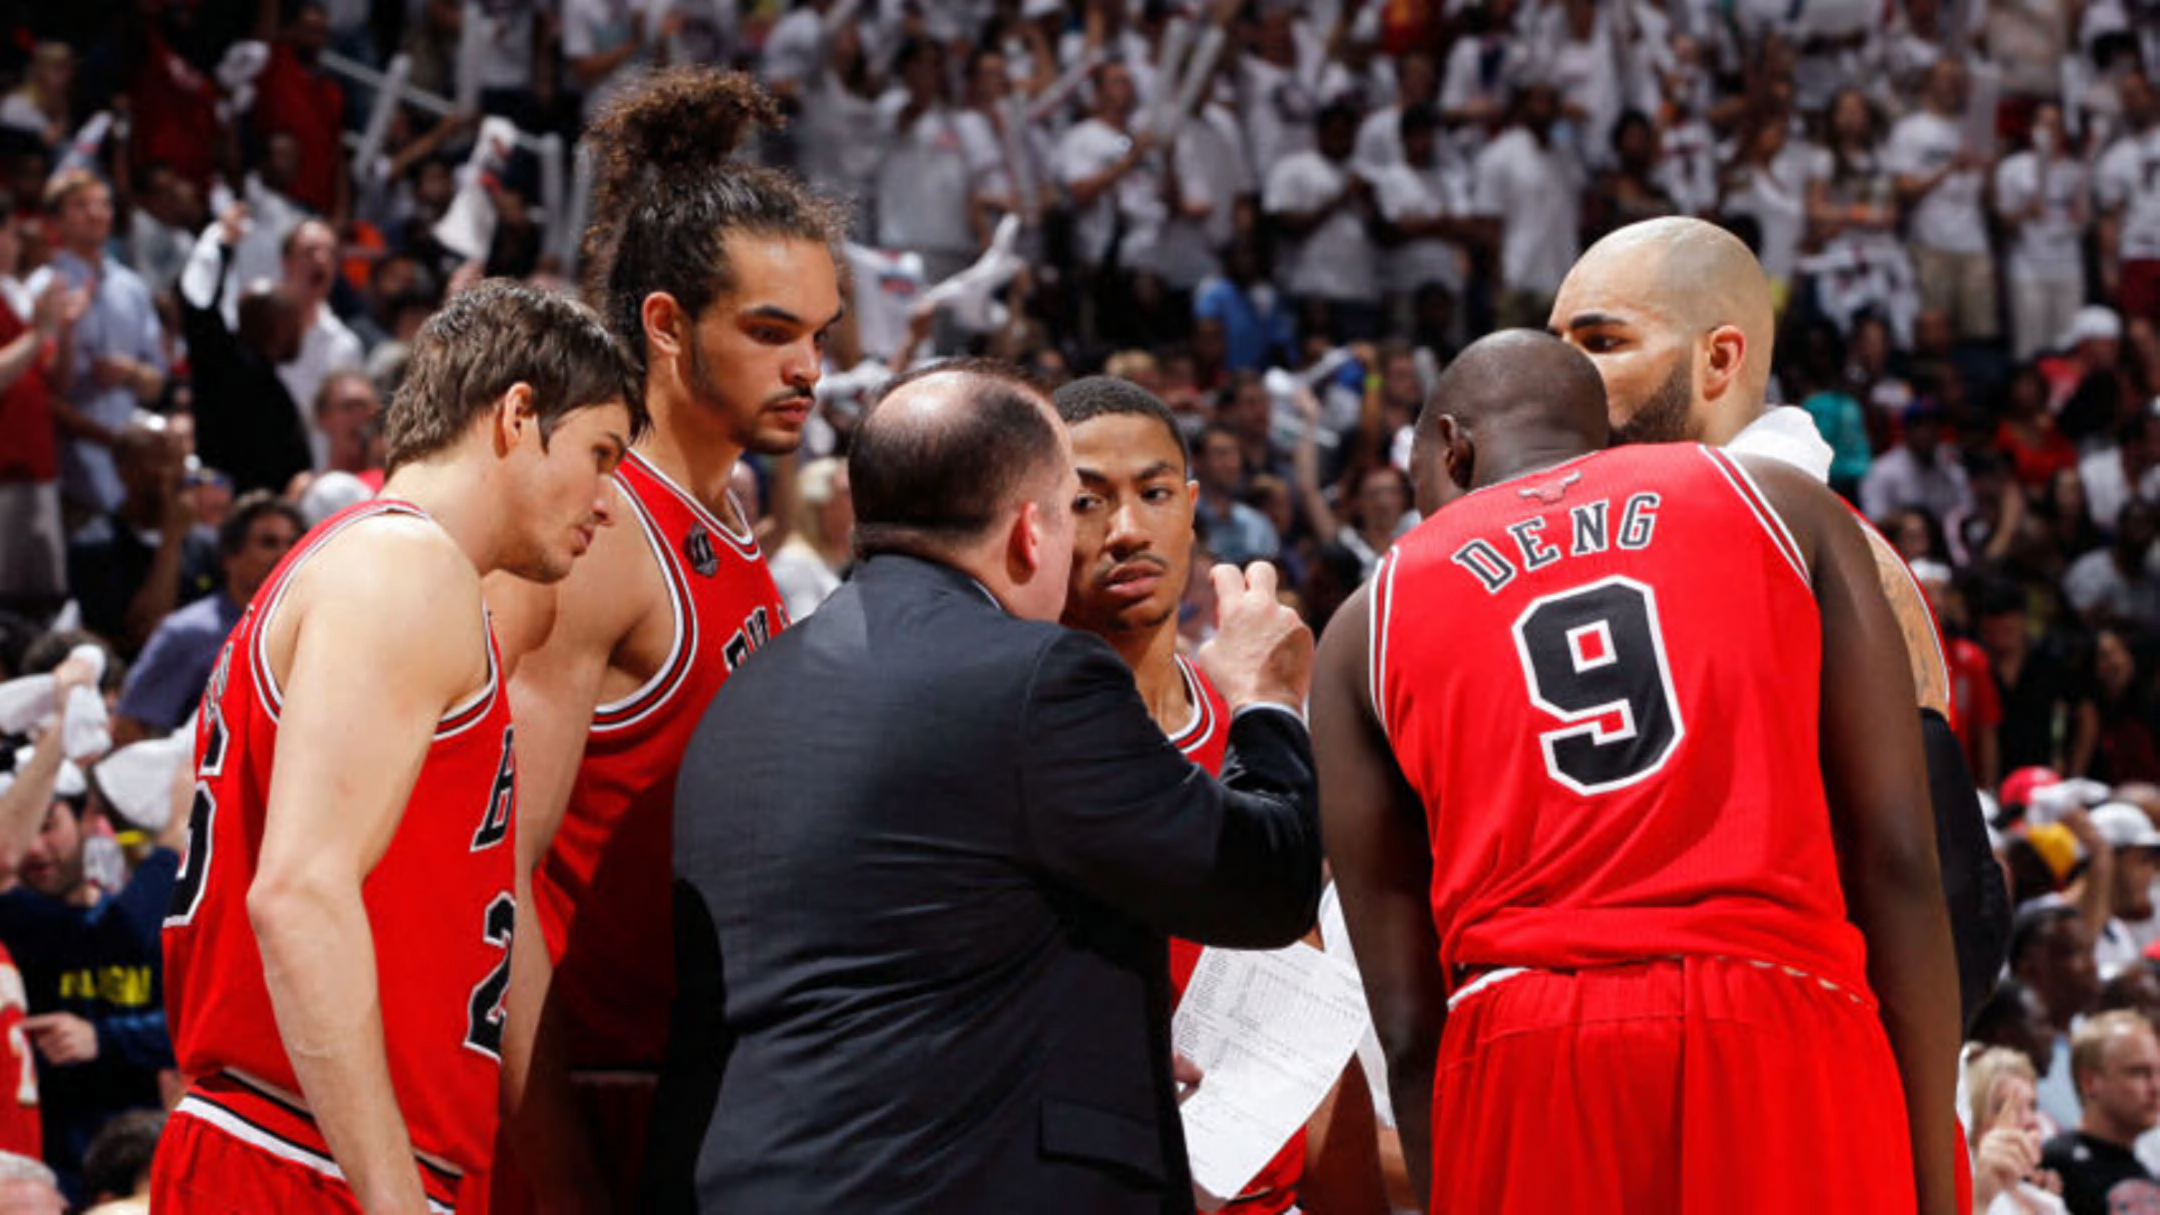
As far as modern Bulls teams go, no roster has better exemplified that than the ones led by Derrick Rose, Joakim Noah, and Luol Deng in the early 2010s. Since that core fell apart, Chicago has been desperately searching for a connection with their team like that ever since. This issue has only been compounded by the fact no Bulls team has been particularly all that good ever since.
It almost seems like the day they let Tom Thibodeau walk, that’s when that connection started to shift. He emphasized toughness, defense, togetherness. All those things, that Chicagoans are proud of. I think people saw themselves on the court in a way that players were going all out during every game.
But after Thibs left, it all started to change. The team became more offense-oriented and lost their grit. Right now, they’re trying to get that connection back. For all his faults, I do understand why Arturas Karnisovas has stressed the importance of continuity and allowed this team time to develop their own identity. But will they be able to do that? It will be interesting to see.
I’m not sure that you can build your team like the Rose Bulls anymore, prioritizing defense first while depending on one player to generate most of the offense. But maybe Chicago’s identity is changing too. And maybe, just maybe, that’s something to be proud of and look forward to, rather than remaining stuck in the past and reminiscing over what-could-have-beens.
Remembering the last truly beloved Chicago Bulls roster of 2012-13
Things in life usually work simply. If the reward outperforms expectations, then you feel happy. But if the opposite occurs, then you feel depressed. And that’s what happened during that season. Before the season, they were ranked 15th in the ESPN pre-season rankings. And that was assuming, that Derrick Rose was coming back in the second half of the season, which in reality never capitalized.
Where they were lacking on offense, they’ve made up on defense. On that end, they were solid as a rock. However, they had a few guys who occasionally had to be hidden in the scheme. Even right now, you can still hear Tom Thibodeau screaming from the sidelines, “Ice! Ice!”
That was their main defensive system and it worked close to perfection. When you have such mobile bigs like Joakim Noah and Taj Gibson on the roster, you can press pretty aggressively. On the pick-and-roll, the main goal was to push the ball handler to the sidelines and away from the screen, even if it would be pushing to their strong hand. Meanwhile, the player on the weakside moved closer to the paint and left his man open in case of help, especially if the roll man tried to go to the basket and the big hadn’t recovered.
Sometimes they would switch, but it wasn’t often. They pushed you toward mid-range jump shots, which is the least effective shot in the game. Utilizing this system, the Bulls finished third in points allowed, by allowing 92.9 points per game.
I think that team embodied the philosophy of Thibs better than any he has had before or had since. They were tough, and truly played together as a cohesive unit. Even though they were 27th in pace, they ranked 8th in assists. Somehow, they accomplished this feat without a true point guard running the show, as their leader in assists was Kirk Hinrich at 5.2 per game.
Keep in mind, that this team was forced to overcome a bunch of injuries. Noah only played 66, Gibson 65, and Hinrich just 60 games. Even with such flux, they still were competitive during the season. That’s why I think, that to this day, it was Thibs’ best coaching job. Sure, you can make a case for his most recent season with the Knicks, but I believe the personnel was better suited for Thibs’ style in Chicago.
In Chicago, Thibs was all about defense, fundamentals, and toughness, and that Bulls team executed all of things at a very high level. And they achieved quite a lot, despite the many hurdles the team faced. They stopped Miami’s infamous 27-game win streak and also defeated the Nets in a postseason duel that would completely change the trajectory of their franchise.
They reached the second round of the Eastern Conference Playoffs, where they gave the Heat a tough battle, even if the Bulls were hobbled. Luol Deng barely played in that series. He played only in five games during those playoffs. Kirk Hinrich played in four.
It’s a good “What if?” that very few people talk about. With both of those guys healthy, I think they could’ve posed Miami a real challenge and maybe even beat them. Remember, the Pacers went on to push them to seven games in the Conference Finals. I think Chicago could’ve done the same thing, if not won outright.
Keep in mind, that Luol Deng averaged 44.8 minutes during that postseason. Plus, he was a primary defender on LeBron James or D-Wade. So, Chicago missed a crucial part of their team. Without him, Jimmy Butler was left alone against those guys. And another thing, Wade got hurt during the streak, and never really recovered. He had bruised knee, tendinitis, and other nagging injuries. With Deng in the lineup, Wade would’ve gone against Butler and that would’ve been a tough challenge.
Would Miami still have prevailed? Maybe.
But there was a world, where Deng played, Chicago advanced, and maybe even qualified for the NBA Finals. Even without those guys, three of those five games were close. Deng would’ve given another option offensively, too. Again, I think Miami would’ve won the series, but it would’ve been a close one.
This 2012-13 team is not mentioned a lot, because they haven’t won a championship. But I believe they represented the city of Chicago to the fullest extent and have left fans desperate for something similar ever since.
4 Historic NBA teams the Bulls have completely devastated
The title of this article may say “completely devastated”, but that may actually be an understatement here. Although the Chicago Bulls have not been able to consistently field competitive rosters throughout their franchise history, when they’ve hit their peaks, they’ve looked nearly unbeatable.
These teams in this article weren’t just beaten, or humiliated, they were set back so far with a loss to the Bulls that it would change the long-term direction of their entire franchise. In some cases, these teams lost more than a decade of progress just trying to pick up the pieces left by the Bulls.
1. Detroit Pistons
We start things off here with one of the sweeter victories for Bulls fans. Unlike several of their 90s rivals who tried to get one-up and over the Bulls, but could never do it, the Detroit Pistons were a much tougher challenge.
They were the Bulls’ neighbors from up north and were even led by a Chicago native in Isiah Thomas. Later on, they’d even acquire another Chicago native Mark Aguirre. Pistons were mentally tough, deep, and greatly coached, there’s no denying that. I won’t go deep into detail about those battles because they’re well documented. What’s interesting, is what happened after Chicago swept them in the playoffs.
A couple of days later, Chuck Daly resigned as their head coach. Jack McCloskey, Pistons general manager left for Minnesota. Before the 1993 season, John Salley got traded to Miami. Later Dennis Rodman got traded for Sean Elliot. And early in the 1994 season, Bill Laimbeer retired. To top it off, Isiah Thomas tore his Achilles, an injury that would ultimately end his career.
After their loss to the Bulls, the Pistons went downhill fast. They wouldn’t become truly relevant again until 2003 when they made conference finals, 12 years later after Chicago beat them into submission.
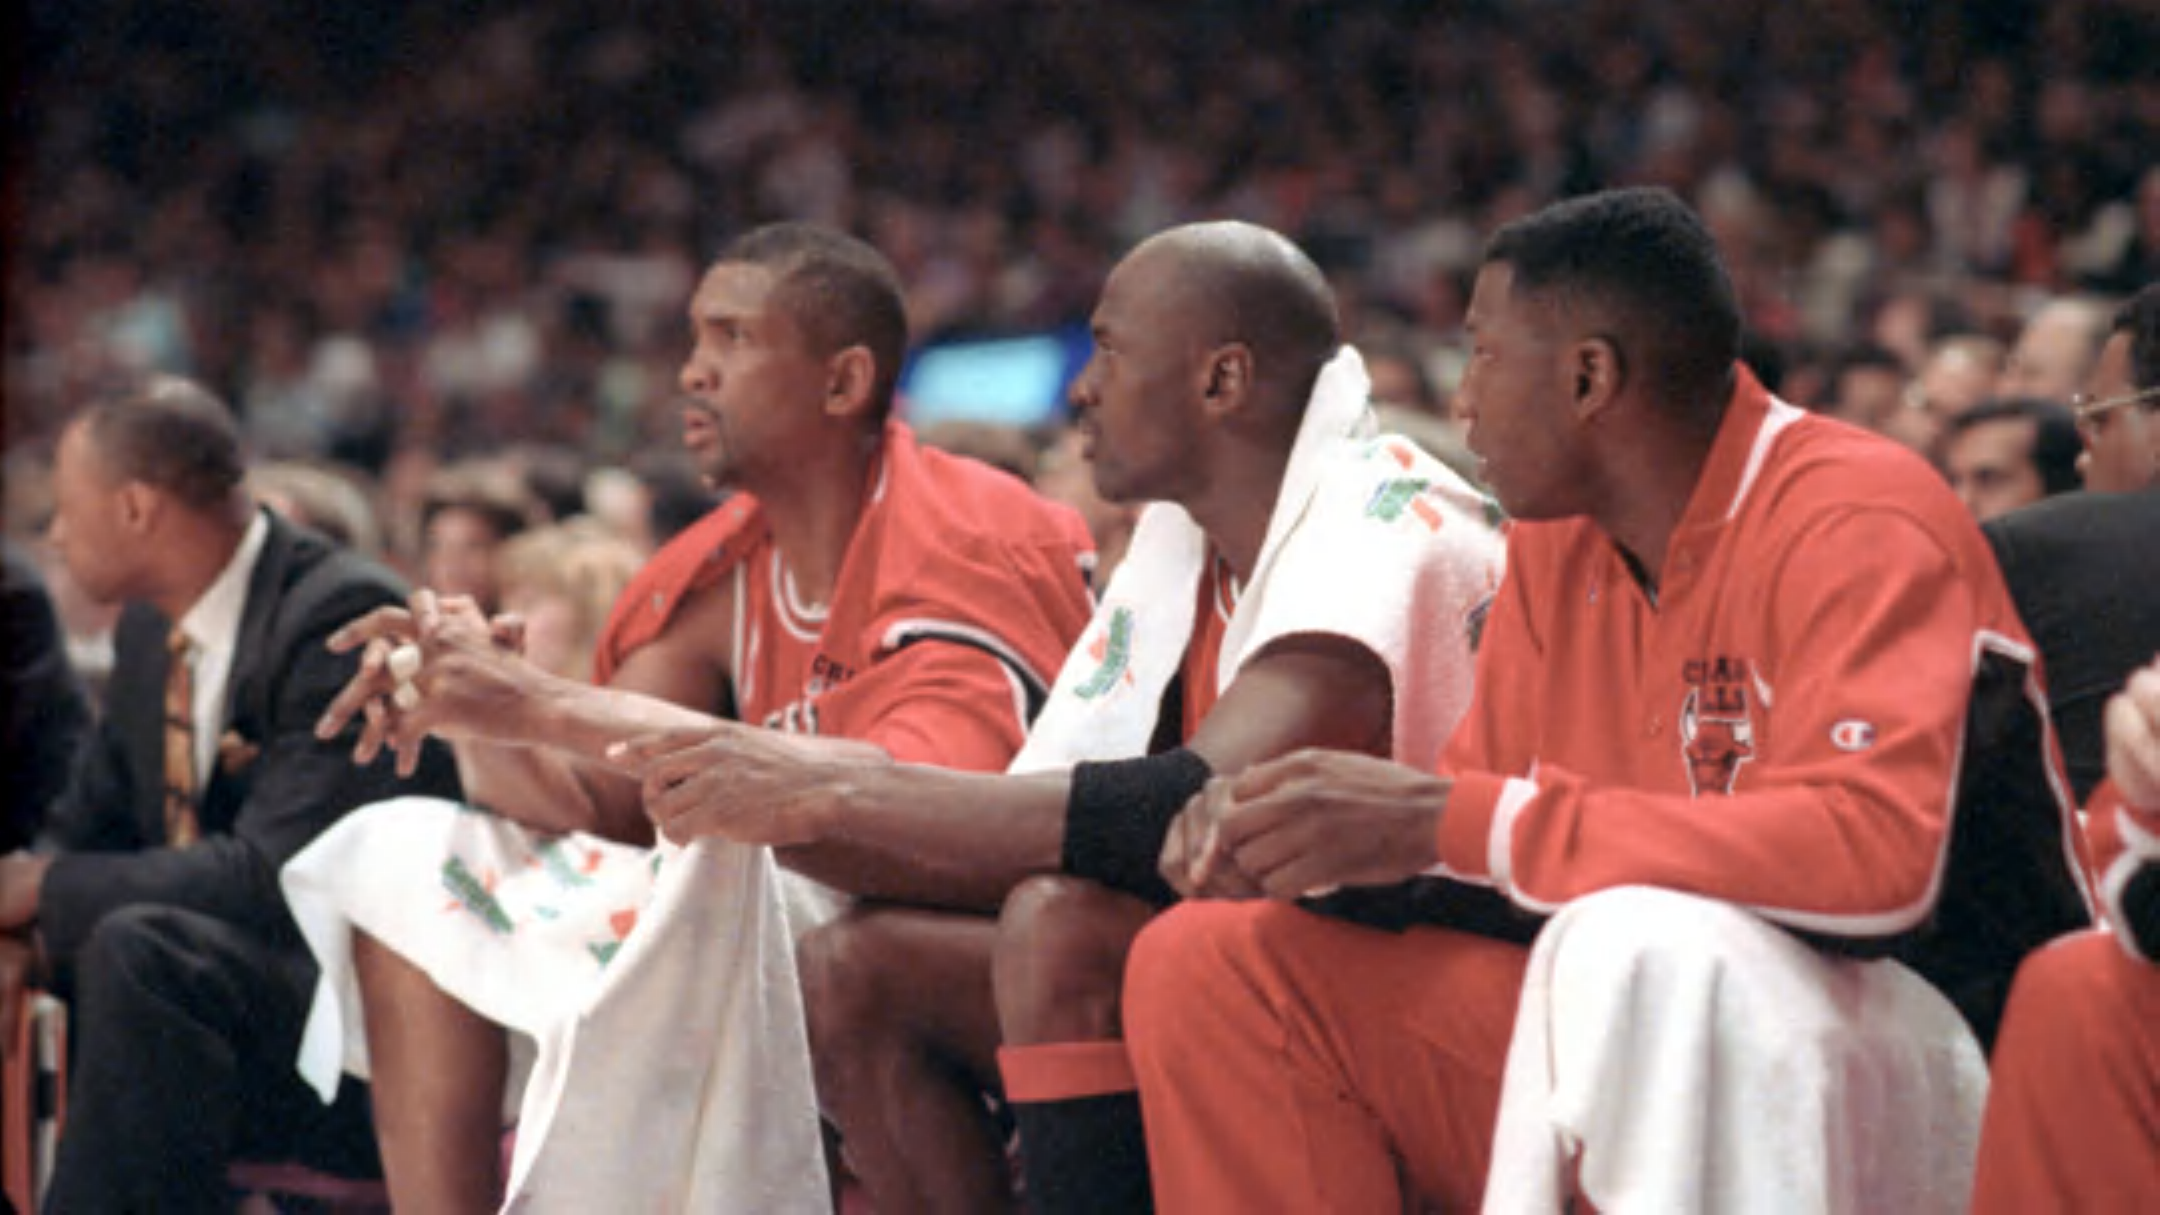
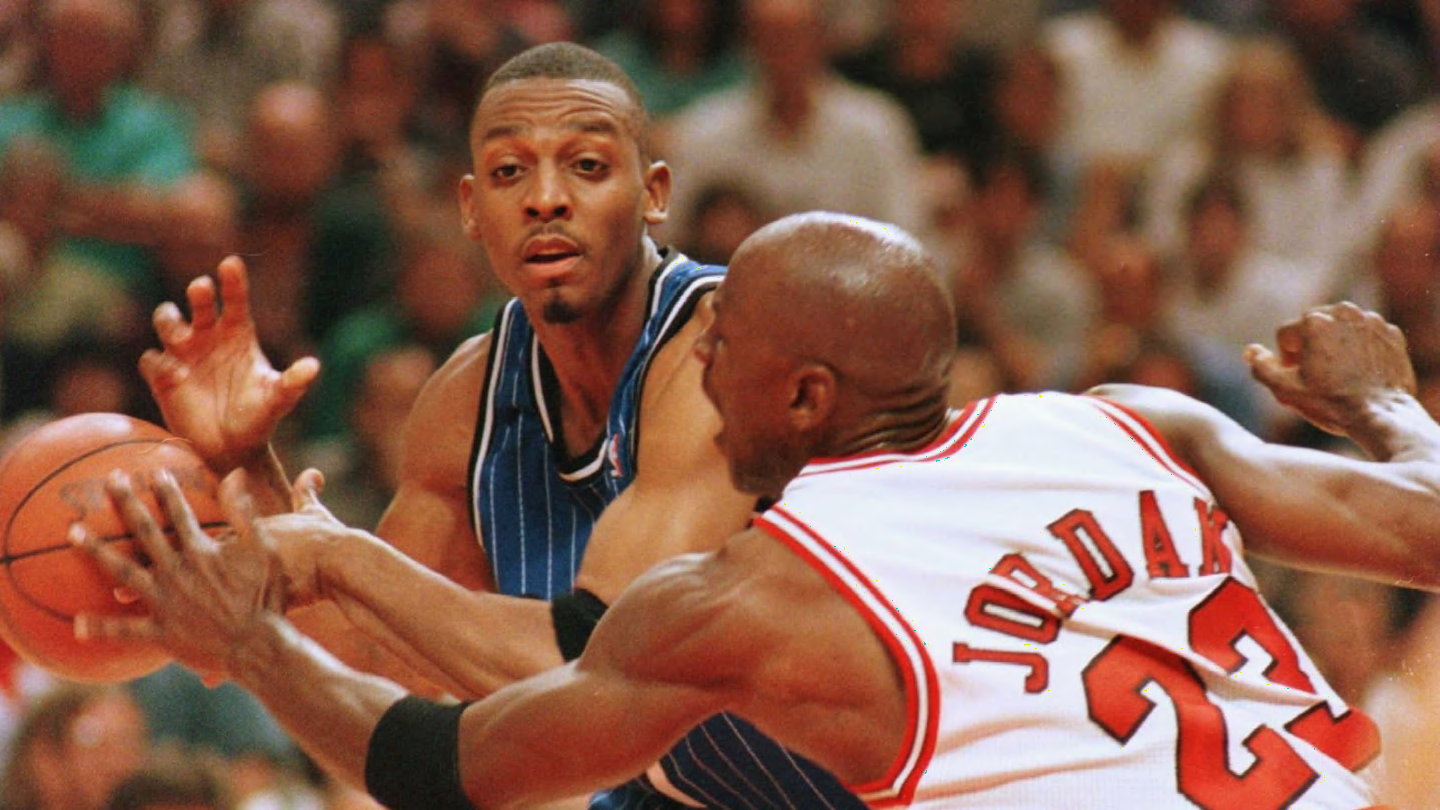
2. Cleveland Cavaliers
Unlike Detroit, Cleveland never had an answer for Michael Jordan. He averaged 45.2 points per game, shot 55.9% from the field, and took zero threes during the series. The next highest scorer on the team was Charles Oakley with 10.8 points per game. The Cavaliers had a more balanced offense, where five guys averaged double digits in scoring, but their inability to stop Jordan cost them the series.
Next year Cleveland had home-court advantage, but still couldn’t get past Chicago. In one of the most memorable series of all time, Bulls had a chance to close the series in Game 4, but Michael missed a free throw and Chicago lost in overtime.
In Game 5, which was a close game all the way through the finish, the Cavs took the lead with 3 seconds left. But it was just enough time for Jordan to hit one of the most iconic shots ever. This time Michael averaged 39.8 points per game, but Scottie Pippen emerged with 15 points per game.
Again, Cleveland had more balanced offense, but couldn’t get past the Bulls. And again, the series was close with neither team winning in double digits. Overall, the Bulls’ margin was 4 points through the whole series. After that, because of the injuries of Ron Harper and Brad Daugherty, the Cavs barely made the playoffs in 1990. A similar situation was in 1991, where Mark Price played only 16 games, the team won 33 and missed the playoffs.
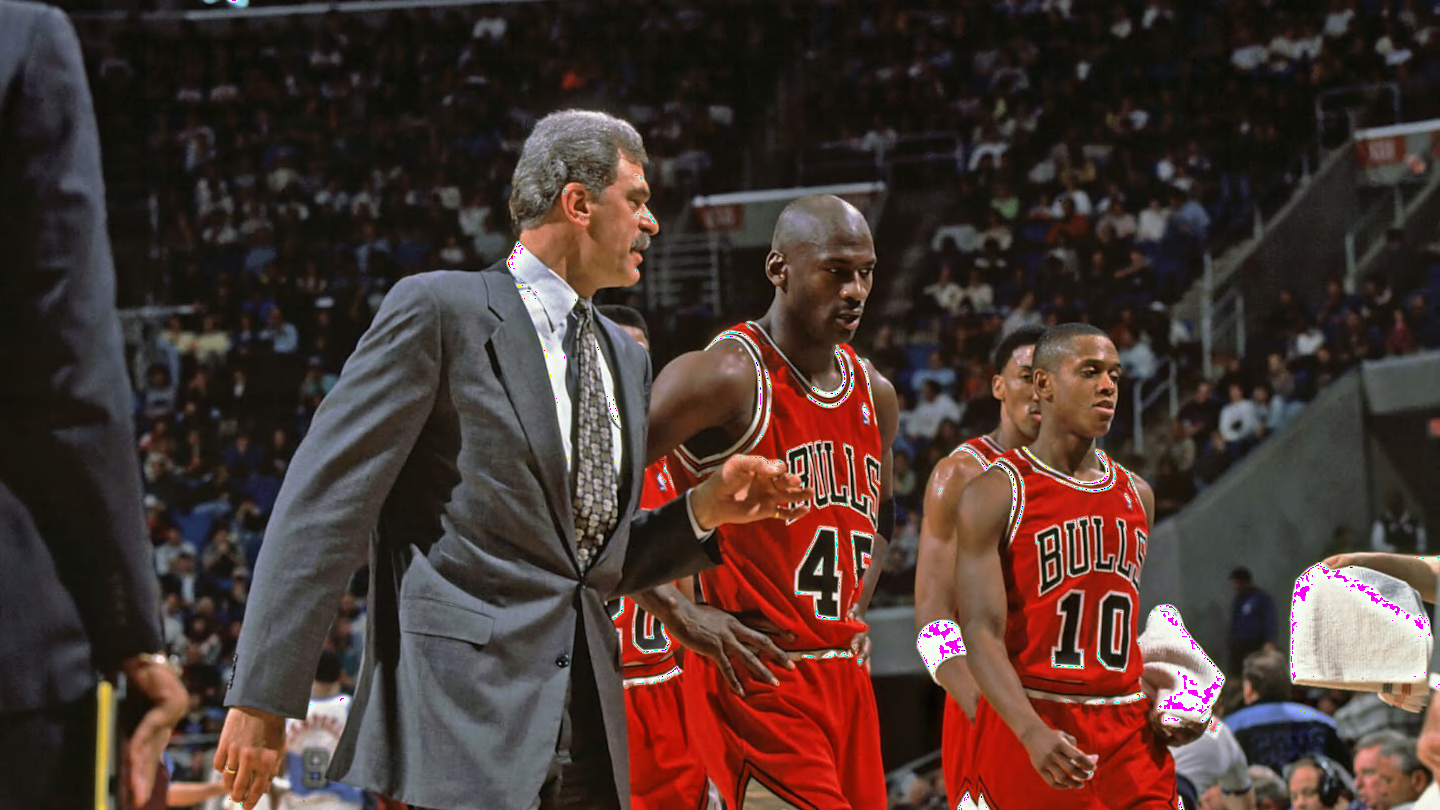
In 1992 they were relatively healthy, won 57 games, and met the Bulls in the Conference Finals. The difference from previous meetings was that the Bulls were defending champions and was coached by Phil Jackson. Cavs gave a pretty fair fight. They won Game 2 by 26 points, which was the worst Bulls loss at home during their championship run. But athleticism and Bulls wings were too much for Cleveland and they lost the series in 6 games.
The next year, Cleveland signed Gerald Wilkins, who allegedly was the Jordan stopper. But this time Bulls completely dominated and left no chance. They swept Cavs in four games. Before the 1994 season, Mike Fratello took charge as Cavs head coach, but the result didn’t change much. Even without Michael, the Bulls swept Cleveland again. This time in three games. Scottie Pippen played brilliantly, where he averaged 25.3 points and 9.7 rebounds during the series.
After that season, this Cavs core imploded.
Brad Daugherty retired because of injuries, Larry Nance retired, and Mark Price got hurt the next year and in 1995 got traded to the Bullets. And that era for the Cavaliers ended abruptly. Even though they’ve made the playoffs a few more times after their last meeting with the Bulls, they weren’t relevant until LeBron James showed up in 2003.
3. Orlando Magic
In the 90s, the Orlando Magic were considered the team of the future. By winning back-to-back No. 1 overall picks, they’ve created one of the most dominant teams of that era. Orlando had big guards in Nick Anderson and Penny Hardaway, a great shooter in Dennis Scott, and the most dominant big of that era- Shaq. By adding Horace Grant, who left the Bulls in the 1994 off-season, they’ve created almost a perfect starting five.
In the 1995 playoffs, they won against the Bulls and they were the last team to beat MJ and the Bulls in the playoffs during that Chicago run. But Chicago got them back a year later. With Michael Jordan in basketball shape and by adding Dennis Rodman, the Bulls steamrolled Orlando. They’ve swept them in four games in the conference finals.
After that, the Magic would make a horrible mistake during the 1996 post-season. Deciding not to pay the eventual Hall of Famer the enormous payday he desired, Shaq instead took his talents to LA to join forces with Kobe Bryant and the Lakers.
During the 1997 season, Penny got hurt and played only 59 games. Other key guys were injured too: Dennis Scott played in 66, and Nick Anderson in 62 games. Even though they’ve made the playoffs, they’ve lost to Miami in the first round. The year after, Penny suffered another injury and played only 19 games, and D-Scott got traded to Dallas. During that season, a total of 22 players laced shoes for the Magic.
Just two seasons after their meeting with the Bulls, Orlando has missed the playoffs. They wouldn’t become relevant again around 2008, with their core around Dwight Howard becoming better but this was 12 entire years after their loss to the Bulls that sent Orlando spiraling.
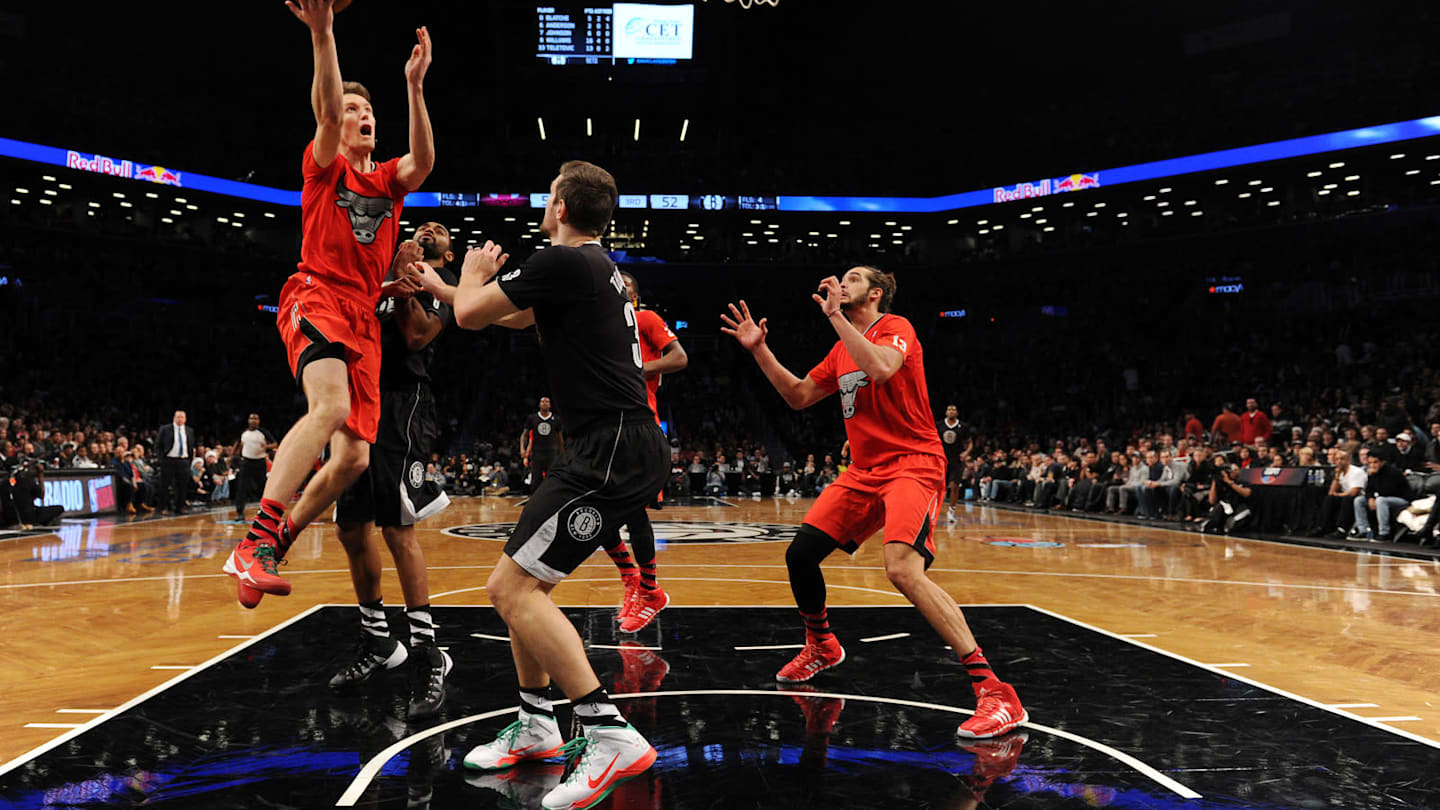
4. Brooklyn Nets
This is a bit more recent one and it doesn’t include the 90s Bulls, but their loss to Chicago in the 2013 playoffs, sent the Nets franchise sideways. When Mikhail Prokhorov bought the Nets in the spring of 2010, he made a promise that the team will win a championship in the next five years…
Brooklyn started by trading for Deron Williams after the 2011 All-Star Break. In the summer of 2012, they acquired Joe Johnson and his humongous contract. With Brook Lopez in the lineup, they became a formidable playoff team in the East. They were projected to be a top-four team. And they finished third in the conference that year.
It was tough seven-game series, but finally, the Bulls prevailed in Game 7 on the road. Even though Chicago was undermanned, they showed incredible heart and determination. In that game, Jimmy Butler played all 48 minutes, while Joakim Noah and Marco Belinelli played over 40. Meanwhile, Joe Johnson went 2-for-14 from the field and the Nets lost the series.
After that series, Brooklyn made a panic move. They executed one of the most infamously inept moves in NBA history by trading for Kevin Garnett and Paul Pierce, which was fine, even though they were 36 and 37 years old. But they gave away four unprotected first-round picks, which later turned into Jaylen Brown and Jayson Tatum.
That’s how with one series Bulls sent Brooklyn reeling for the next few seasons. They became relevant again in 2019 when KD and Kyrie signed up with the Nets. That wasn’t until six years later after Chicago’s defeat.